
Track your financial progress on a yearly, quarterly, or weekly basis. Identify trends in seasonality, geography, inventory, sales and cross reference data for stronger data driven decisions. Utilize charts or dashboards to easily visualize key business indicators.
Scheduling
Financial analysis and projections can come on a variety of timelines. For acquisitions time and data is sensitive, while day-to-day operations can be more complex models. Project timelines will vary depending on complexity of goals.
Satisfaction guarantee
Once you see accurate, interactive finance charts making data informed business decisions becomes easier, and tracking affects of decisions at a glance or in dashboards brings peace of mind.
Quality control
Data quality is the crux of what analysis is capable of. As such, data is verified prior to beginning of analysis, during analysis, and finished products.
Overview
As a growing company Shelton Properties is always on the lookout for acquisitions. As part of negotiations financials and various data was shared for the past 4 years. Shared data was also utilized to identify business value and purchase negotiations.
The goal of the evaluation was to determine 1. validity of valuation 2. future financial trends 3. if purchase would be a positive, financially viable business acquisition.
Various charts were created and built into an interactive dashboard, which change based on the topic of interest. One of the interactive functions allowed for the change in finances based on traffic as opposed to advertising dollars.
Client: Shelton Properties
Location: Salt Lake City, UT
Services: Website evaluation for purchase
Findings
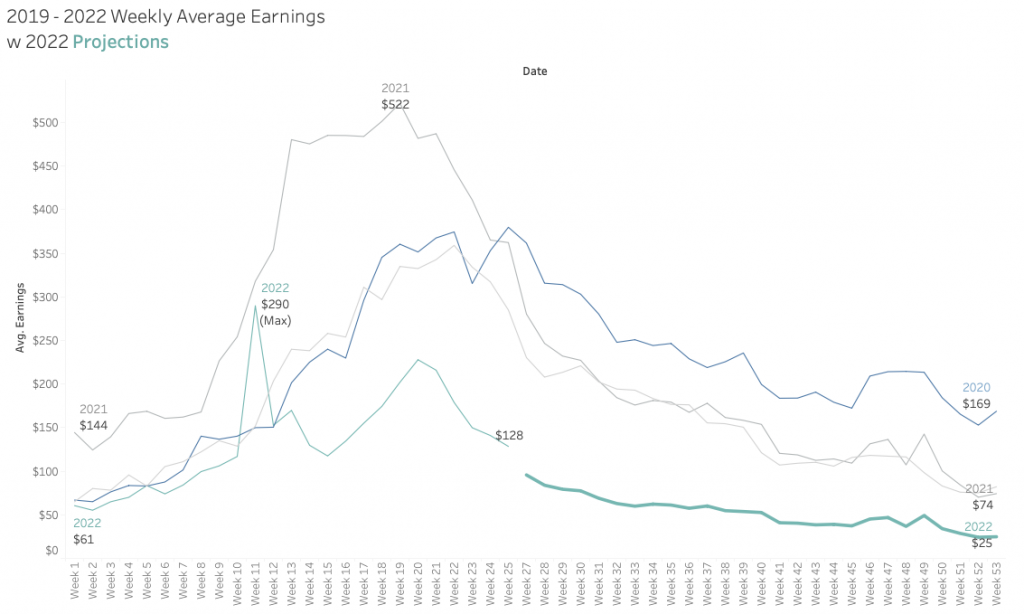
Long term financial analysis identified the valuation and asking price for the website was too high, advertising funding was declining, and site traffic was seasonal, limiting potential earnings.